A Visual Guide to DSP - Teaching Assistance
Around December 2020, I was assigned as a TA for the sophomore level module Digital Signal Processing and was tasked with helping them solve some tutorial questions.
During my time as a student, I felt lost in this module and got a grade of B+. However, over next few semesters, I learnt on my own and picked up a strong intuition in DSP. I picked the elective Advanced Signal Processing in the final semester and received an A.
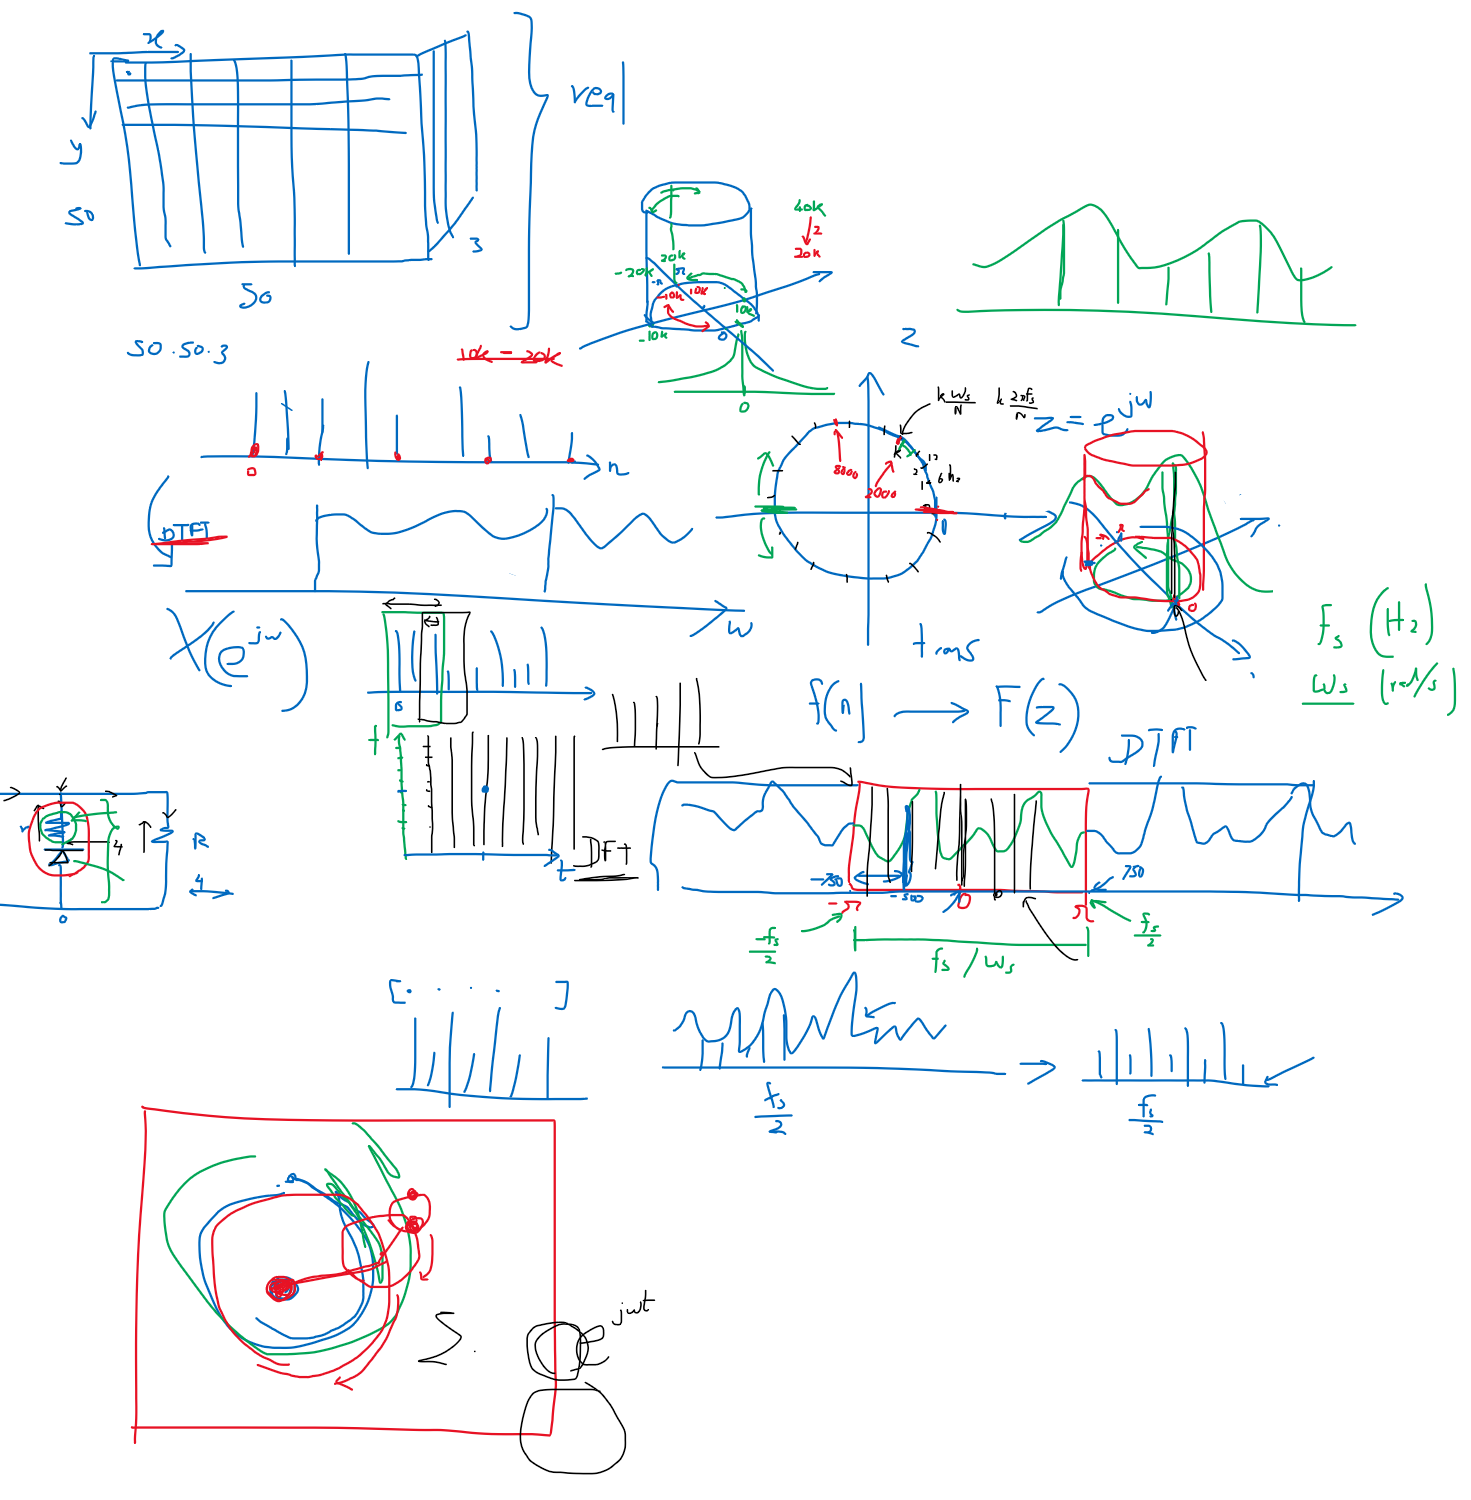
As a TA, I made sure to go an extra mile and convey my intuition to the students. In addition to weekly tutorial sessions where I solve questions from Alan V. Oppenheim's Discrete-Time Signal Processing, I taught the students intuitive filter design. Apart from mathematical equations, I introduced the unit cylinder in Z-domain and showed how the frequency response changes as we move the poles and zeros around.
Students loved these sessions, sending informal feedback and also requesting additional sessions. I greatly enjoyed teaching them.
Session recording: dms.uom.lk/s/Wo9QHEoRFtm7WPB
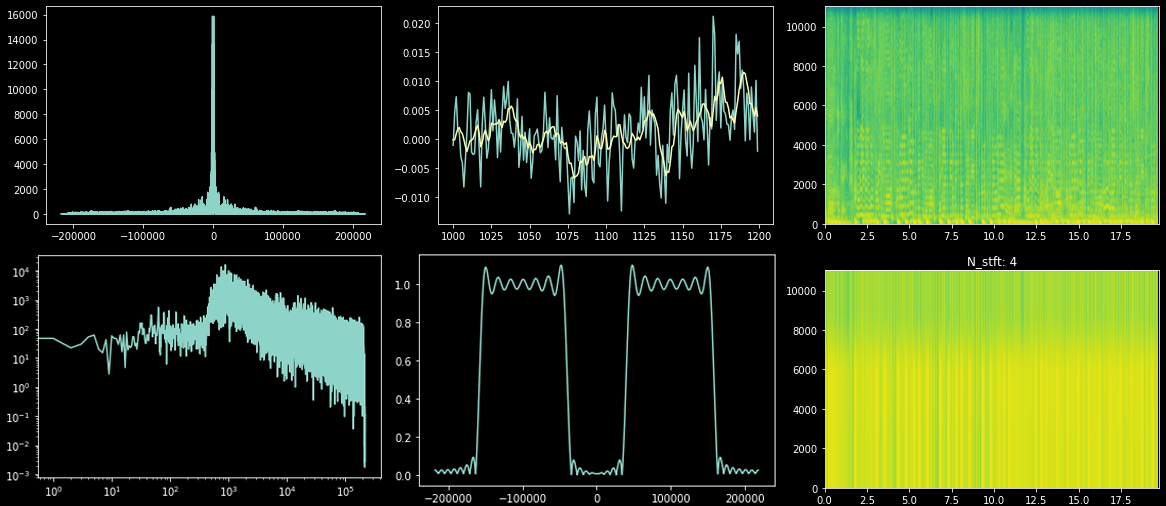
On the last day, I did a special session, where I showed a complete overview of DSP practically. I showed how enough circles rotating on top of each other can create any 2D image, basically the Fourier theorem. Then I took a song, filtered it in different ways and showed what happens. I also talked about filtering a 2D image, giving a glimpse of what happens in higher dimensions.
Google Colab
Click the following link to access the interactive DSP session. Code and results are shown together in an online notebook, where you can play audio files, see the effect of filters on them, and observe 1D and 2D frequency domain filtering results.